2001 - JAMB Mathematics Past Questions and Answers - page 6
51
A
45o
B
55o
C
25o
D
50o
Ask EduPadi AI for a detailed answer
Share this question
52
A
16
B
17
C
14
D
15
Ask EduPadi AI for a detailed answer
Share this question
53
A
3/25
B
2/25
C
1/5
D
4/15
Ask EduPadi AI for a detailed answer
Share this question
54
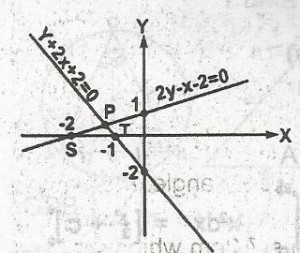
A
2y - x - 2 \(\leq\) 0, y + 2x + 2 \(\geq\) 0, x \(\geq\) 0
B
2y - x - 2 \(\geq\) 0, y + 2x + 2 \(\leq\) 0, -2 \(\geq\) x \(\geq\) -1
C
-2 \(\geq\) x \(\geq\) 2, y \(\leq\) 0, y + 2x + 2 \(\geq\) 0, x \(\geq\) 0
D
2y - x - 2 \(\geq\) 0, y + 2x + 2 \(\geq\) 0, y \(\leq\) 0, x \(\geq\) 0
Ask EduPadi AI for a detailed answer
Share this question
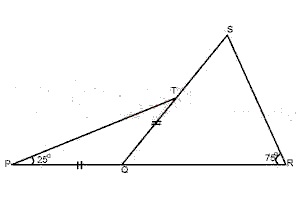
55
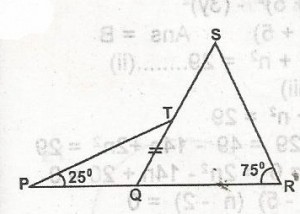
A
50o
B
25o
C
55o
D
45o
Ask EduPadi AI for a detailed answer
Share this question
56
A
60o
B
100o
C
120o
D
30o
Ask EduPadi AI for a detailed answer
Share this question
57
A
\(\frac{1}{5}\)
B
\(\frac{2}{25}\)
C
\(\frac{4}{15}\)
D
\(\frac{3}{25}\)
Ask EduPadi AI for a detailed answer
Share this question
58
A
\(\frac{1}{2}(Q_3 - Q_1)\)
B
Q3 - Q2
C
Q3 - Q2
D
Q3 - Q1
Ask EduPadi AI for a detailed answer
Share this question
59
A
17
B
16
C
15
D
14
Ask EduPadi AI for a detailed answer
Share this question